Are Layer 2 Networks Good for Uniswap Liquidity Providers?


Uniswap V3 has moved beyond Ethereum to layer 2 networks that utilize scaling technologies such as optimistic roll-ups and sidechains. Liquidity Providers (LPs) using Uniswap V3 should ask themselves whether bridging to a layer 2 network can generate more fees than staying on Ethereum. To help LPs make the decision, we looked at data from September 2022 to determine which pools had the highest fee return.
Fee Return: A Measurement for Comparing Uniswap V3 Pools
Each Uniswap V3 pool is divided into slices, called ticks, that set the price boundaries where liquidity changes. By facilitating trades within a specific range of ticks, LPs can amplify the liquidity provided by their underlying tokens as opposed to providing liquidity for all possible prices. As the price of a pool crosses a tick, liquidity is kicked into or out of the pool’s active liquidity.
Active liquidity can change frequently as the price moves, but luckily, each pool tracks the fees generated from a single unit of active liquidity in an accumulator value. By comparing the difference in the fee accumulator over a period of time, we can calculate the fees generated from a single unit of active liquidity.
We converted the accumulated token fees into a single quote token, then divided it by the value of a unit of liquidity at the start of the month. We arrived at a fee return, measured in Basis Points (BPS), that allows us to compare the fee generation ability of different pools grouped by their underlying token exposures. In this case, we will review ETH/USD, ETH/BTC, and ETH/UNI exposure groups on Uniswap V3. Pools with essentially no liquidity were not included in the data set.
ETH/USD
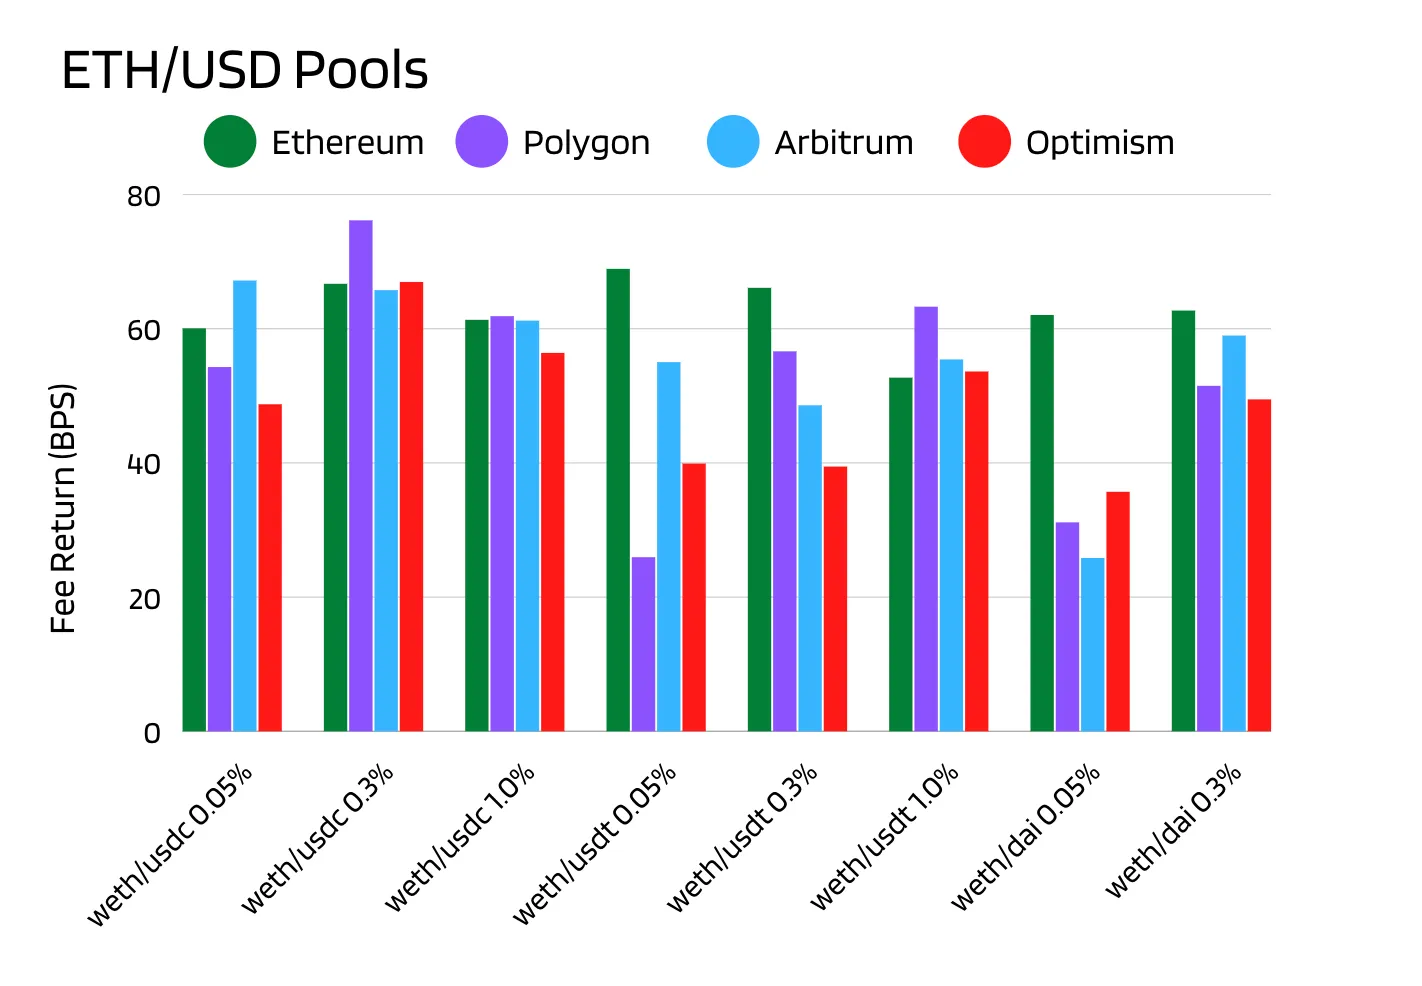
ETH/USD exposure can be expressed by pairing Wrapped ETH (WETH) with a number of different USD stablecoins on Uniswap V3. We analyzed WETH token pairs utilizing USDC, USDT and DAI, as these held the most liquidity across networks.
Polygon’s WETH/USDC 0.30% pool produced the highest fee return at 76 BPS among the ETH/USD exposure group in September 2022. Ethereum’s WETH/USDT 0.05% pool came in second at 68 BPS and significantly beat the same pair on different networks. Pools with substantially low liquidity and a low fee tier, such as the WETH/DAI 0.05% pool on layer 2 networks, performed poorly because they were likely unable to facilitate enough volume.
ETH/BTC
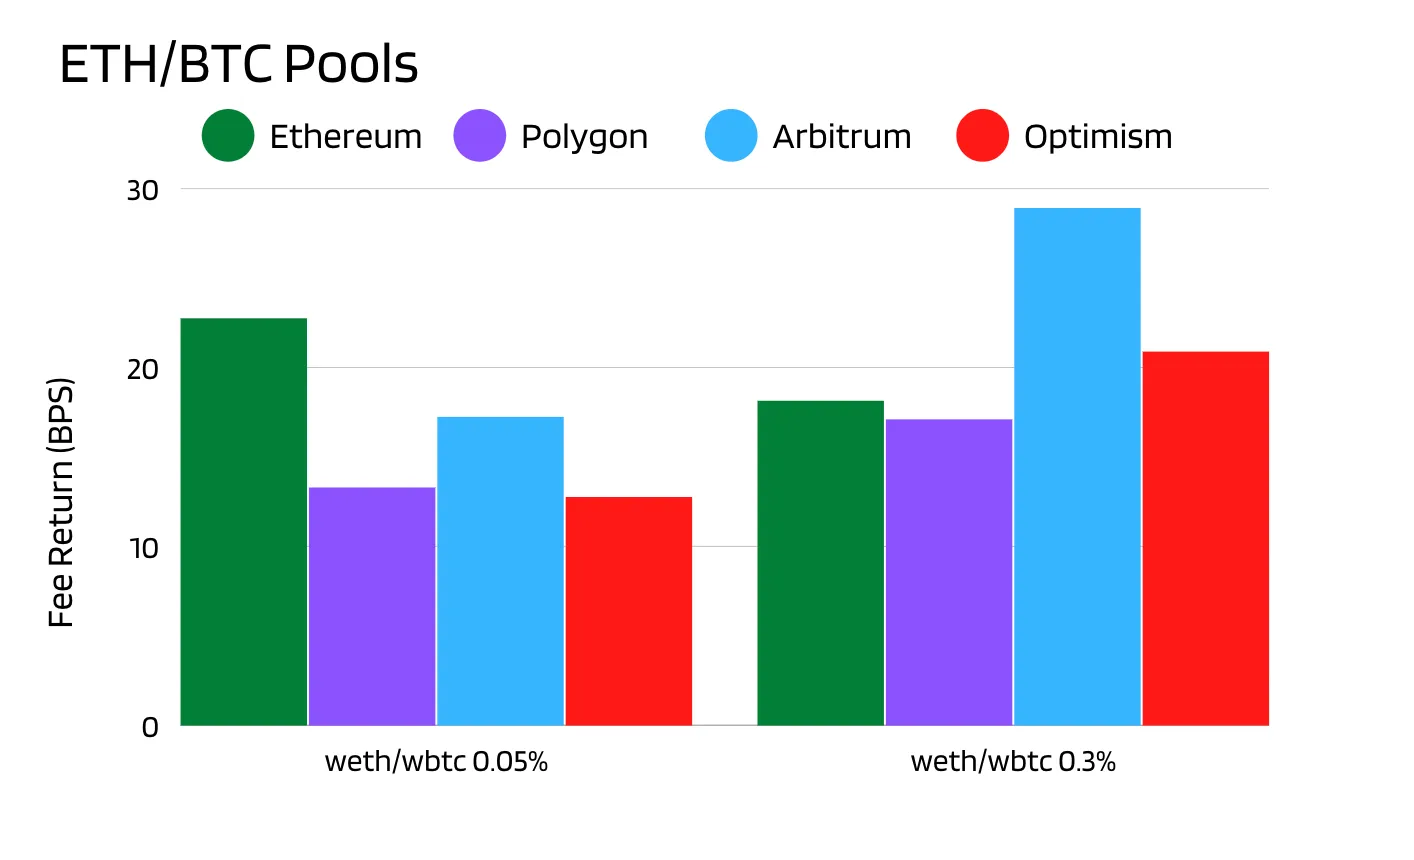
Out of the ETH/BTC exposure group, Arbitrum’s WETH/WBTC 0.30% pool performed the best with 28 BPS. The next best was Ethereum’s WETH/WBTC 0.05% pool at 22 BPS. Optimism’s WETH/WBTC 0.05% pool had the lowest fee generation at 12 BPS, and Polygon’s WETH/WBTC 0.05% had nearly the same fee generation at 13 BPS.
ETH/UNI
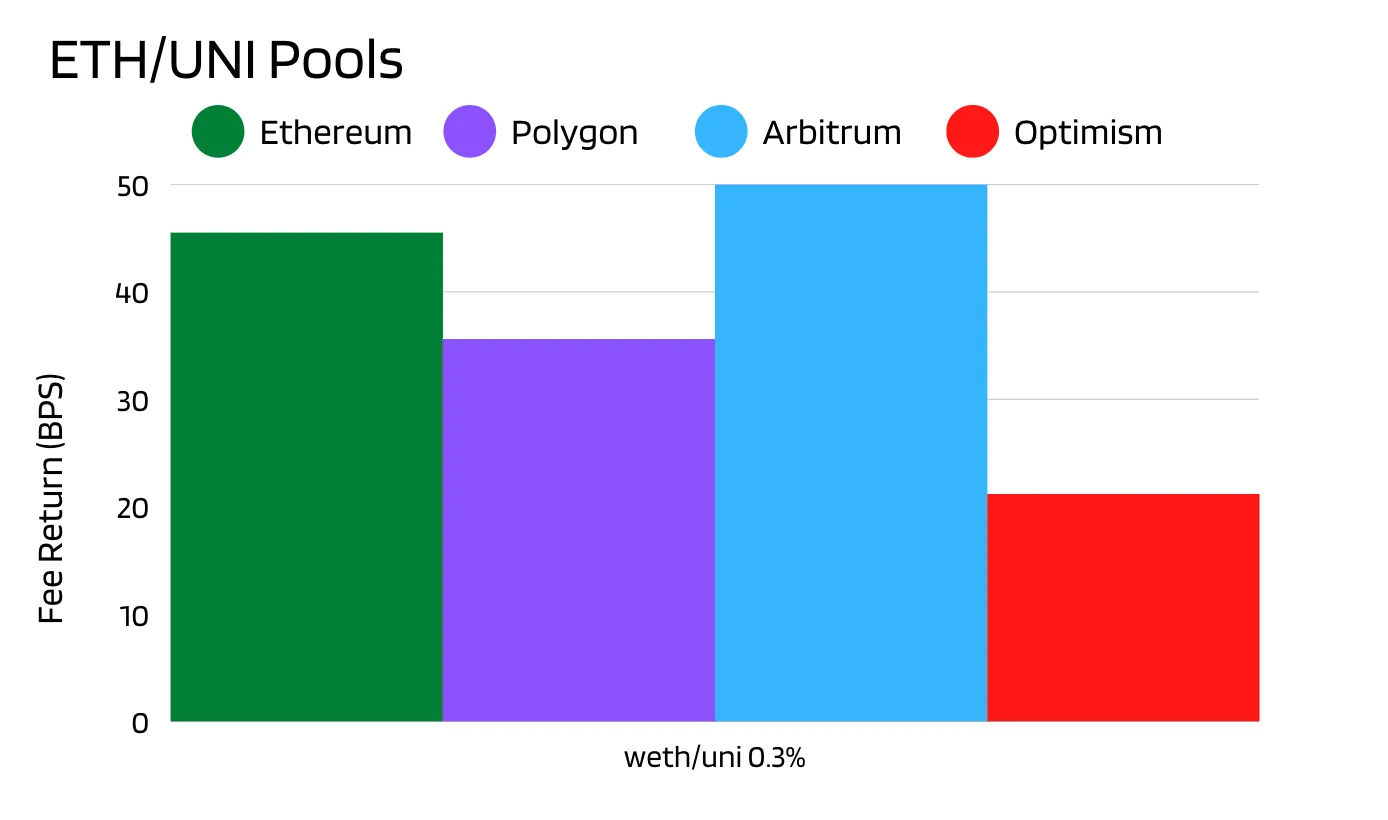
For the ETH/UNI exposure group, Arbitrum’s WETH/UNI 0.30% pool showed the best performance pool with 49 BPS. Optimism’s WETH/UNI 0.30% pool produced the lowest fee return at 21 BPS.
Summary
When making decisions about where to deploy liquidity, LPs should certainly consider the fee return available on layer 2 networks. Layer 2 networks had the highest fee return among each exposure group in September 2022, with Polygon leading the ETH/USD pools and Arbitrum leading the ETH/BTC and ETH/UNI pools.
We can guess that the difference in performance across networks and pools is likely due to variations in trading flow. Perhaps the leading pools capture additional natural flow because of trader preferences and fee dynamics. Lagging pools often held a brutal combination of low liquidity and a low fee tier. Future work should examine the cause of outperformance using additional data.